# Charts 4 PHP Framework Documentation
## Setup
### Installing Demos
Step 1) Place all files in a directory on the web server. e.g. ".../www/chartphp/"
Step 2) Run the product demos in browser. e.g. http://localhost/chartphp/index.php
### Integration in your Project
For integration in your app, copy 'lib' folder to your project. You might need to consider 2 things.
Step 1) The folder "../../lib" will be replaced by path where you place 'lib' folder (if changed)
Step 2) Update include path where you place lib/inc/chartphp_dist.php. (if changed)
include("../../lib/inc/chartphp_dist.php");
$p = new chartphp();
### Upgrading from older version
Simply override `lib/inc` & `lib/js` from latest build to the chartphp folder in previous implementations.
Same applies to upgrade from free to full version.
[^ Top](#top)
## Getting Started
### Creating your First Chart
Step1: Add PHP Chart configuration code
data =array(array(3,7,9,1,4,6,8,2,5),array(5,3,8,2,6,2,9,2,6));
$p->chart_type = "area";
// render chart and get html/js output
$out = $p->render('c1');
?>
Step2: Include JS and CSS files in your html page
Step3: Print the `$out` variable where you wish to display chart.
#### Resources
- [Live demo](http://www.chartphp.com/demo/)
- You can check this demo in archive `demos/basic/area.php`
#### Explanation
- The PHP Part configured the chart and rendered the output to $out variable.
- In HTML Part, we displayed the generated chart code `$out` along with few external css/js files. It's up to you to place external css and js files at appropriate locations.
- `->render()` will generate the final output, to be displayed in view. It takes **chart ID** as input, which should be unique on a page.
## Setting Chart Options
Based on following example code, we can add many other chart params.
data =array(array(3,7,9,1,4,6,8,2,5),array(5,3,8,2,6,2,9,2,6));
$p->chart_type = "area";
// render chart and get html/js output
$out = $p->render('c1');
?>
### Chart Type
Currently following chart types are supported:
- line
- area
- area-stacked
- bar
- bar-grouped
- bar-stacked
- candlestick
- donut
- error-bar
- pie
- bubble
- heatmap
- histogram
- meter
- funnel
Usage:
$p->chart_type = "area";
### Chart Title
$p->title = "Category Sales";
### Chart Labels
$p->xlabel = "My X Axis";
$p->ylabel = "My Y Axis";
### Chart Ticks
$p->showxticks = true;
$p->showyticks = true;
### Target Line
The target line can be applied to bar, bar stack and bar group chart.
#### Set Targetline x axis start
$p->targetx_start = 20;
#### Set Targetline x axis end
$p->targetx_end = 20;
#### Set Targetline y axis start
$p->targety_start = "Hybrid";
#### Set Targetline y axis end
$p->targety_end = "Truck";
#### Set Targetline color
$p->targetline_color = "green";
#### Set Targetline width
$p->targetline_width = 4;
#### Set Targetline style, it can be `dashdot` or `line`
$p->targetline_style = "dashdot";
#### Resources
- [Live demo](http://www.chartphp.com/demo/basic/bar-target.php)
- [Sample code](http://www.chartphp.com/demo/basic/bar-target.phps)
### Chart Legend
#### Set legend labels
$p->series_label = array("Team1","Team2","Team3","Team4");
#### Set legend orientation
$p->legend["orientation"] = "h";
#### Hiding legends
$p->legend["show"] = false;
### Chart Logo
You can specify custom logo by giving:
- source ( URL or local path),
- position (top-left, top-right, bottom-left, bottom-right, center)
- transparency between (0-1). 1 means full opaque.
Example:
$p->logo["source"] = "http://domain.com/logo.png";
$p->logo["position"] = "top-left";
$p->logo["transparency"] = 0.8;
### Bar, Bar Stack, Bar Group Chart Direction
$p->direction = "horizontal";
### Chart Data
You can either specify data points:
$p->data = array(array(array("2010/10",48.25),array("2011/01",238.75),array("2011/02",95.50)));
or include a file with data arrays
include("../../example_data.php");
$p->data = $area_chart_data;
To create chart directly from database query:
$p->data_sql = "select c.categoryname, sum(a.UnitPrice * a.Quantity) as Sales
from products b, `order details` a, categories c
where a.productid = b.productid and c.categoryid = b.categoryid
group by c.categoryid
order by c.categoryid";
For Database driven charts, refer 'Database Integration' topic in docs.
### Chart Colors
To specify the colors manually, the number of colors specifications must be more than or equal to data values.
// set color to green for one data value
$p->color = "green";
// set color to red,blue,green for three data values
$p->color = "red,blue,green";
// set colors using rgb
$p->color = ["rgb(148,0,211)","rgb(0,0,255)","rgb(0,255,0)" ,"rgb(255,0,0)"];
// set colors using hex code
$p->color = "#1AAF5D,#F2C500,#F45B00,#8E0000,#0E948C";
// set colors using color series
$p->color ="soft";
// set metro theme color series
$p->color ="metro";
// set heatmap color series
// Options: green, orange, gray, hot, violet, black, blue, soft
$p->heatmap_color = "black";
More than one colors are used for pie,donut,bubble OR e.g. multi-line chart.
### Chart Background Color
You can specify different background color (beside white on light theme, black on dark theme).
$p->bgcolor = "#3d3d3d";
You can also set transparency with colors
// 5% white color background
$p->bgcolor = "rgba(255,255,255,0.05)";
or simply full transparent
$p->bgcolor = "transparent";
### Chart Theme
By default charts come with light theme. To switch to dark theme background, you can set:
$p->theme = "dark";
### Chart Dimensions
You can specify width x height in % or px.
$p->width = "80%";
$p->height = "100%";
### Export Options
You can hide/show export button on chart top-right:
// defaults to true
$p->export = false;
## Database Integration
Step1 is to set database configuration in config.php.
To connect to MySqli:
define("CHARTPHP_DBTYPE","mysqli");
define("CHARTPHP_DBHOST","localhost");
define("CHARTPHP_DBUSER","user");
define("CHARTPHP_DBPASS","pass");
define("CHARTPHP_DBNAME","northwind");
To connect using PDO:
define("CHARTPHP_DBTYPE","pdo");
define("CHARTPHP_DBHOST","sqlite:../../sampledb/Northwind.db");
define("CHARTPHP_DBUSER","");
define("CHARTPHP_DBPASS","");
define("CHARTPHP_DBNAME","");
Next is to include configuration file in your code.
include("../../config.php");
Final Step is to define `data_sql` property, that will load data points from database.
$p->data_sql = "select strftime('%Y-%m',o.orderdate) as Year, sum(d.quantity) as Sales
from `order details` d, orders o
where o.orderid = d.orderid
group by strftime('%Y-%m',o.orderdate)";
#### Resources
- [Live demo](http://www.chartphp.com/demo/demos/database/bar.php)
- [Code Sample](http://www.chartphp.com/demo/demos/database/bar.phps)
- You can check this demo in archive `demos/database/bar.php`
## Google Sheets Integration
Step 1: Give permission to access to access Google Spreadsheet
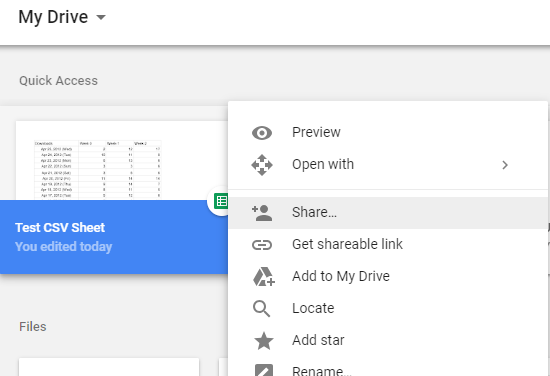
Before proceeding to next step make sure that your google sheet have _permission to view_ :
Goto your My Driver folder and right click on the spreadsheet you want to share. Then select : _“Anyone with the link can view “_from dropdown . _(See screenshots)
Step 2: Add your spreadsheet key and sheet name
Change the key and sheet_name as given in your spreadsheet with following format :
https://docs.google.com/spreadsheets/d/{key}/gviz/tq?tqx=out:csv&sheet={sheet_name}
in our case, after adding key and sheet name, the url becomes
https://docs.google.com/spreadsheets/d/1KkNJxvjhpjyzUu-0EW0xmhnYxKN8RPeEqhctxKJkx3s/gviz/tq?tqx=out:csv&sheet=Sheet1`
Step 3: Include Charts 4 PHP Library
include("../../lib/inc/chartphp_dist.php"); $p = new chartphp();
Step 4: Set your google sheet url in a string
So finally we have this link (saved in url variable) :
$url = "https://docs.google.com/spreadsheets/d/1KkNJxvjhpjyzUu-0EW0xmhnYxKN8RPeEqhctxKJkx3s/gviz/tq?tqx=out:csv&sheet=Sheet1";
$p->data_csv_url = $url;
In our case-example the sheet is:
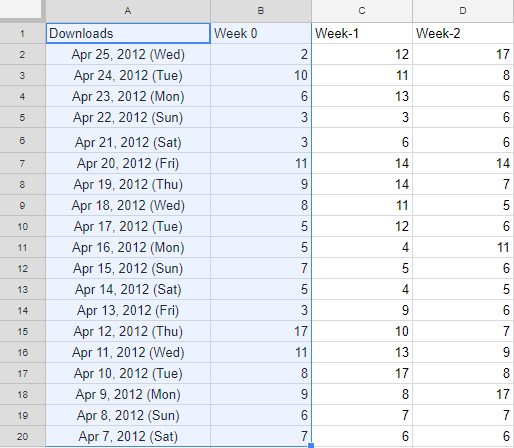
By default , first column (Downloads) and second column (Week 0) are selected (highlighted above). To make charts from other 2 columns, see [Documentation](http://www.chartphp.com/docs/).
Also Note that the chart will be made for 2 columns only. More than 2 columns are currently not supported.
If you want to override csv file x and y column numbers you can do like this :
$p->csv_xindex = 1;
$p->csv_yindex = 2;
Step 4: Set title for the chart
```
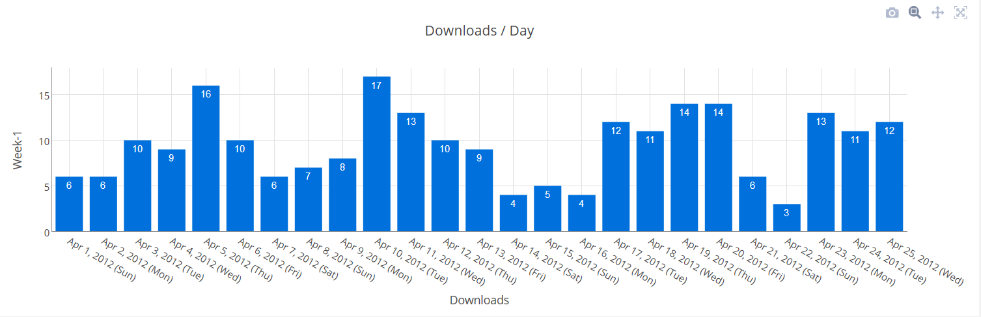
$p->title = "Downloads / Day";
```
Step 5: Render Chart
```
$out = $p->render("c1");
```
Result:
#### Resources
- [Live demo](http://www.chartphp.com/demo/demos/integration/google-sheets.php)
- [Code Sample](http://www.chartphp.com/demo/demos/integration/google-sheets.phps)
- You can check this demo in archive `demos/integration/google-sheets.php`
Updated: Tuesday, Feb 5th, 2019